01
Research facilities
Spaces and tools for studying risk.
Research teams combine laboratory capabilities and analytical methods according to the study. Equipment suitability and access are considered as part of each collaboration.
INFRASTRUCTURE
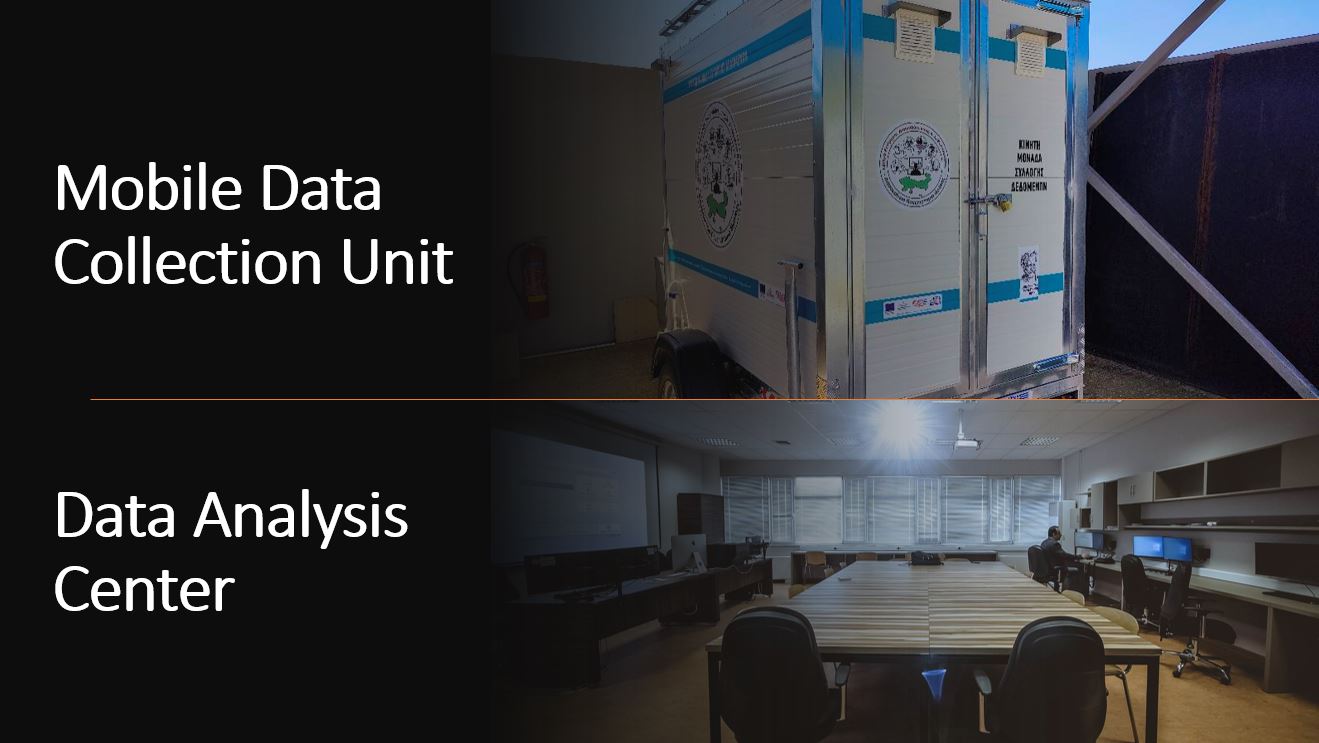
Research facilities, a data analysis room and a mobile measurement platform support data collection and the study of hazardous events.
Spaces and tools for studying risk.
Research teams combine laboratory capabilities and analytical methods according to the study. Equipment suitability and access are considered as part of each collaboration.
Where individual observations come together.
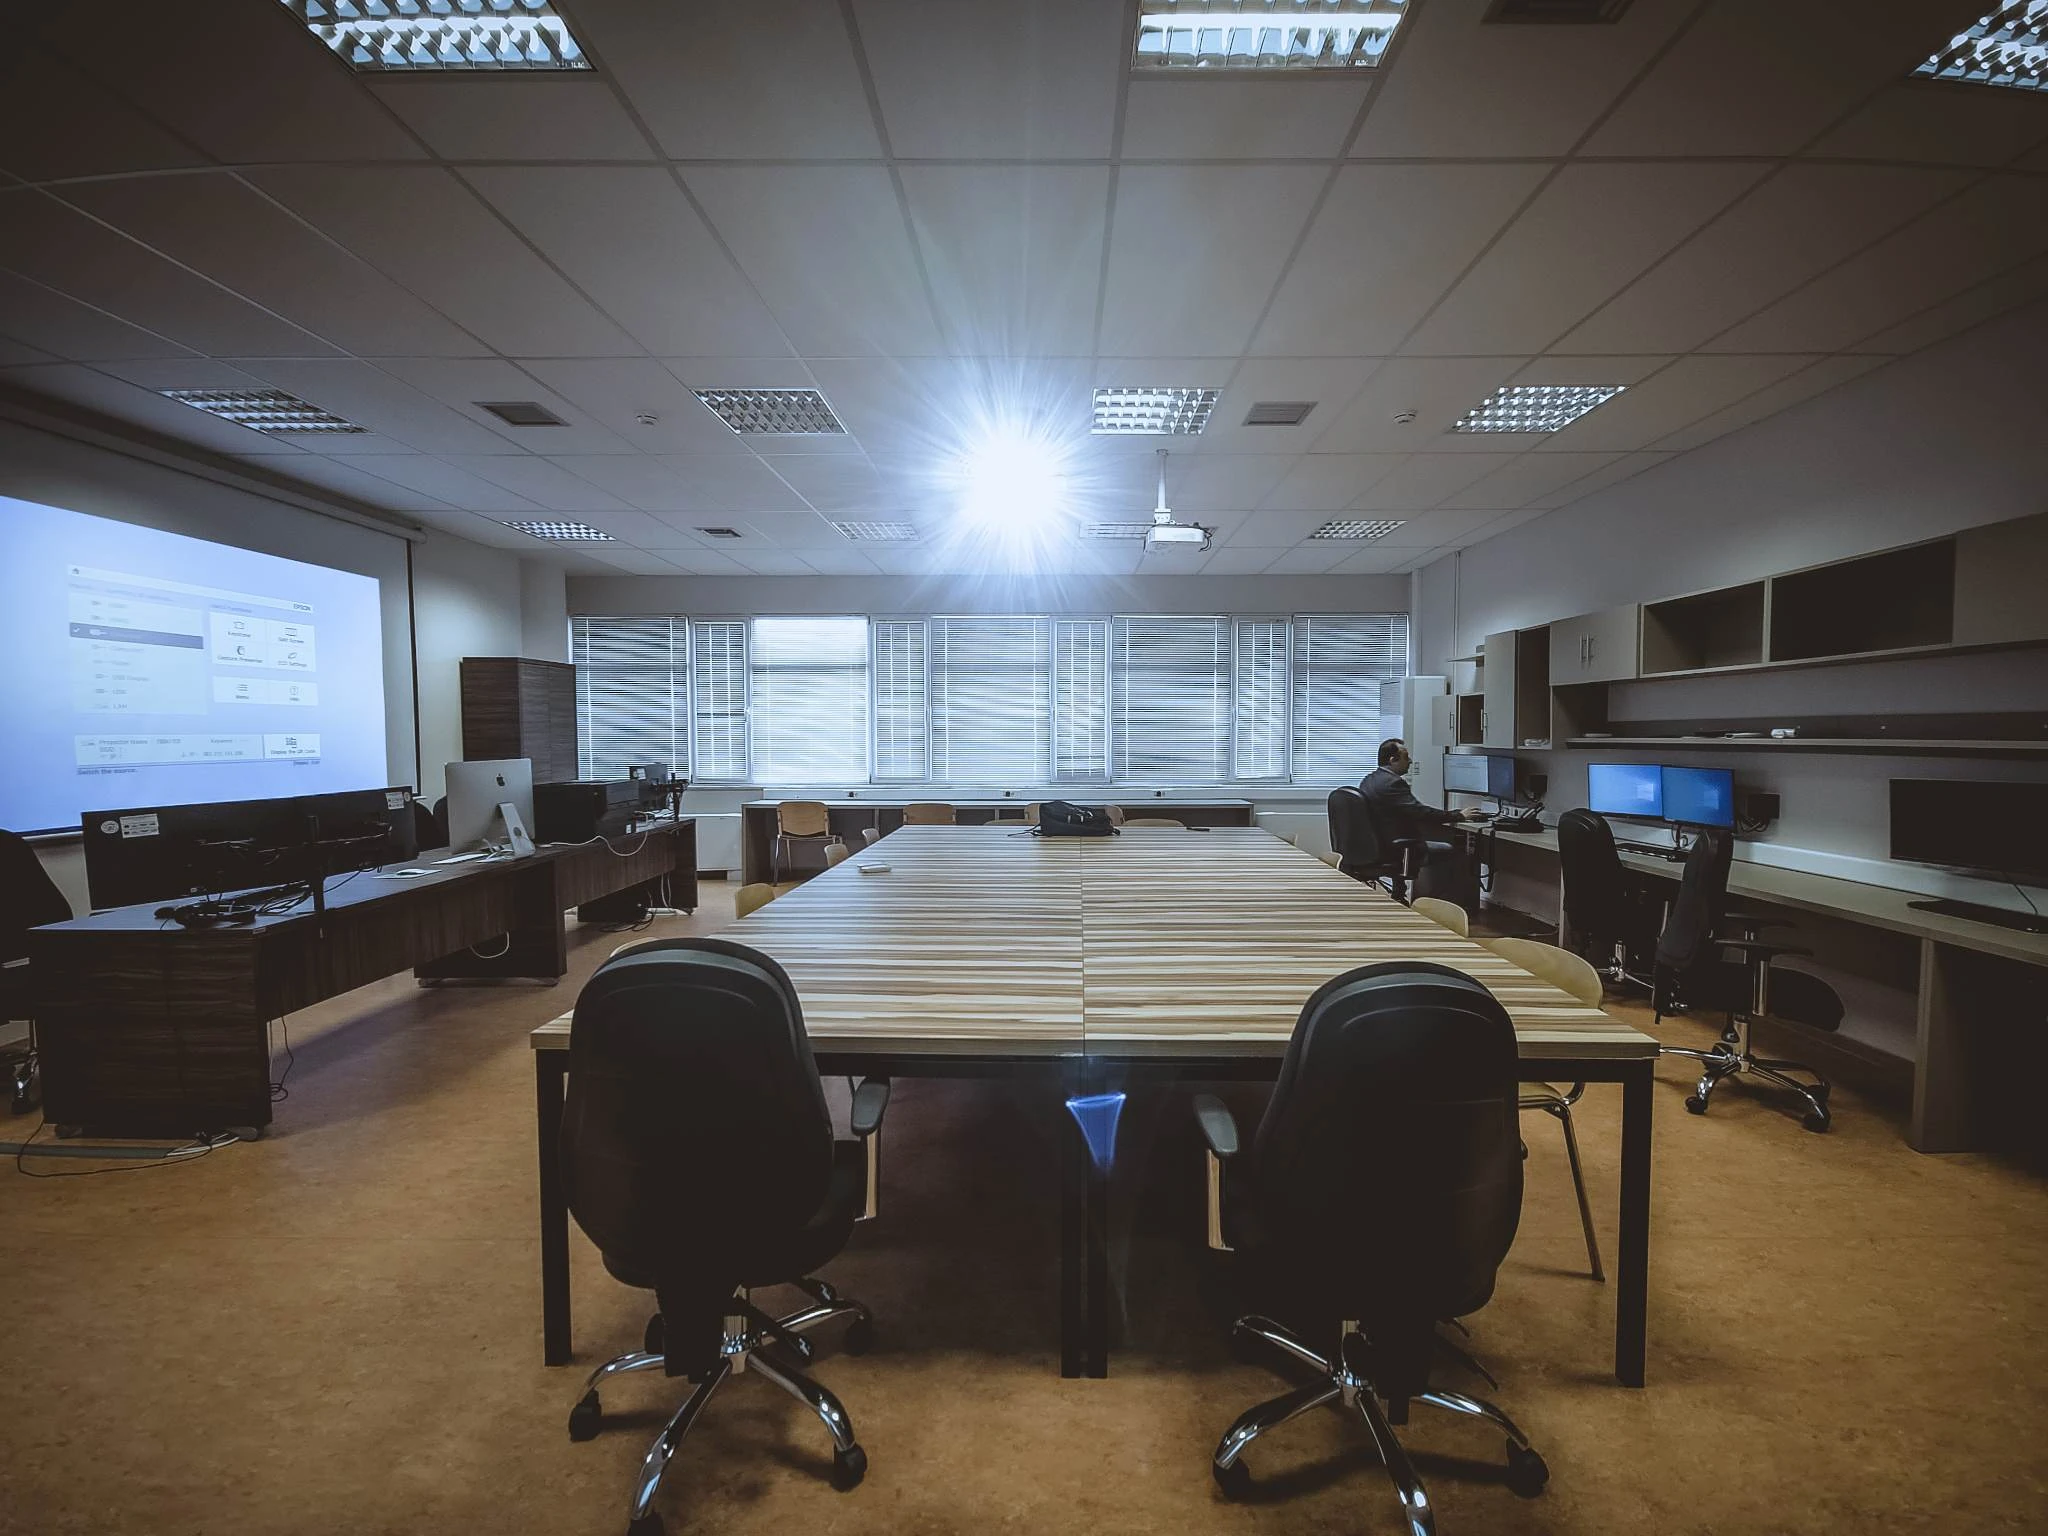
The data analysis room supports information synthesis, model review and collaboration between research teams. Analyses are accompanied by their assumptions and limitations.
Bringing research into the field.
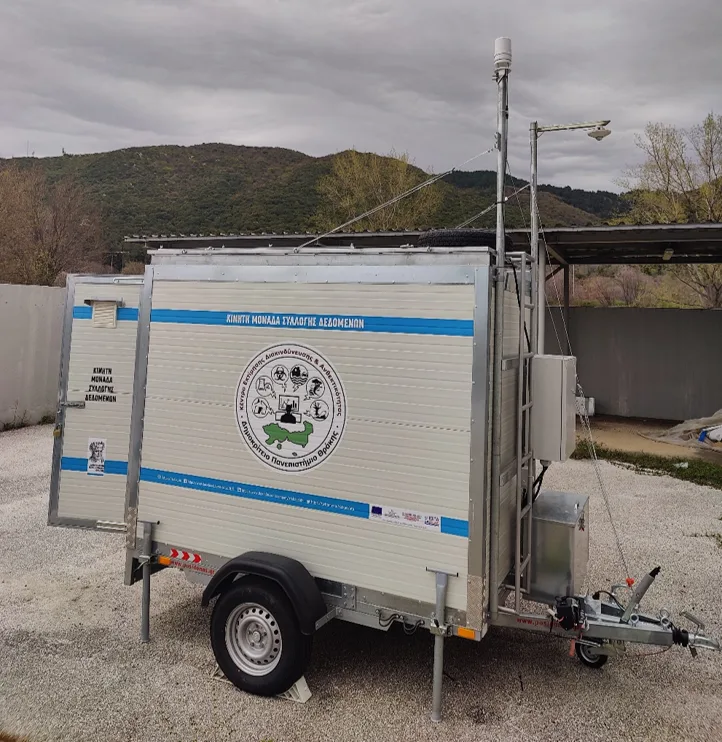
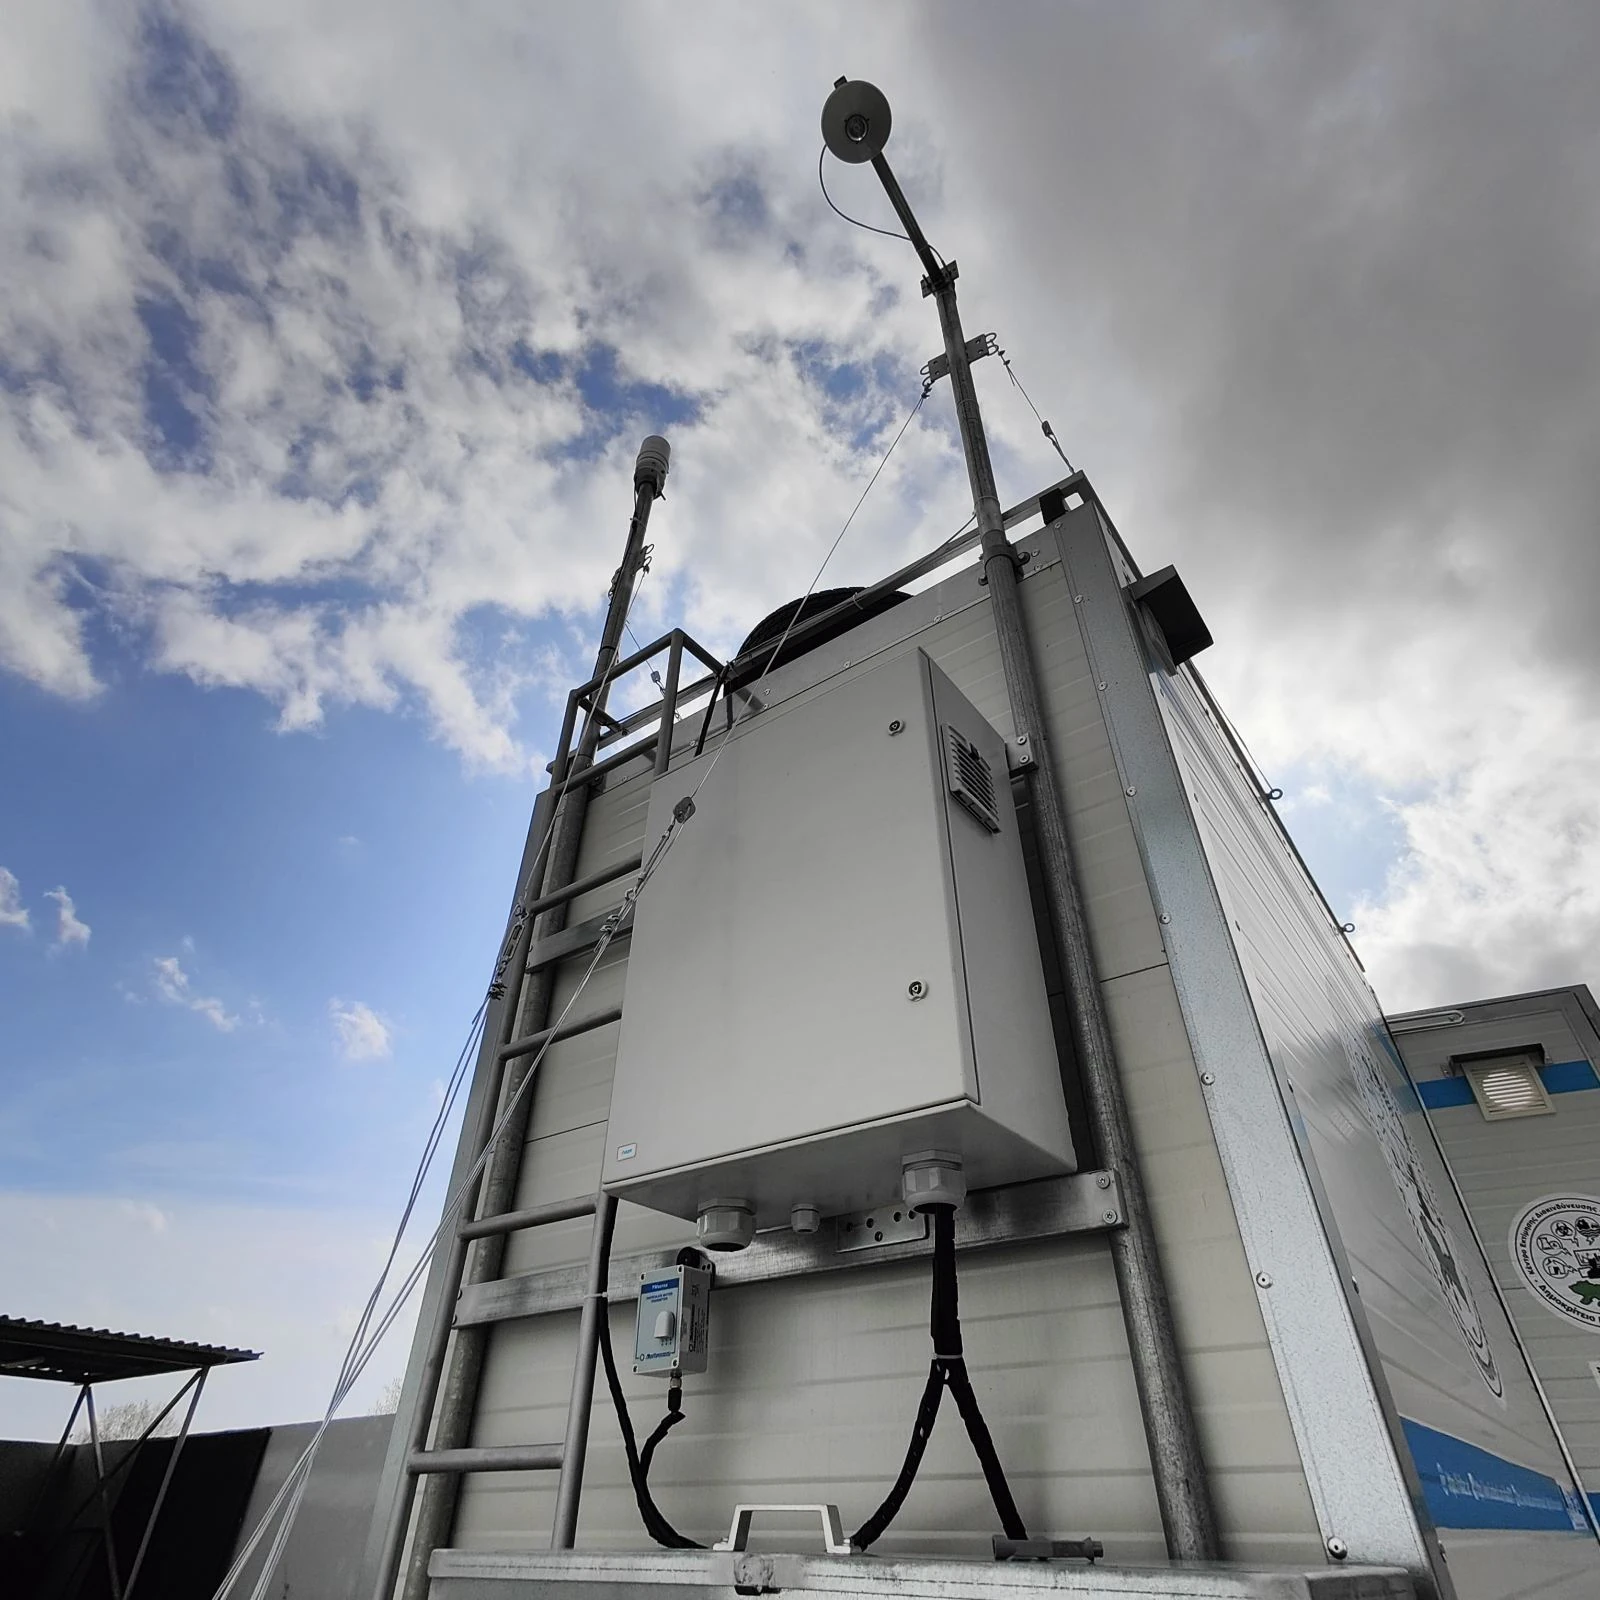
The mobile platform consists of a trailer with a removable cabin and is used for field measurement campaigns. Campaign design, available sensors and field conditions determine the type and quality of the data.
RISKAC INFRASTRUCTURE
RESEARCH TOOLS
The room supports data collection, storage and analysis, as well as the development and distribution of hazard and consequence scenarios.
The infrastructure description includes the following examples of instruments and laboratory tools.
Tools recorded in the description cover data analysis, mapping and simulation.
The WebGIS is designed to store, process and share research findings as vector maps.
These capabilities are documented in the research infrastructure description. Equipment availability and suitability for a specific task are confirmed when planning a collaboration.
FIELDWORK
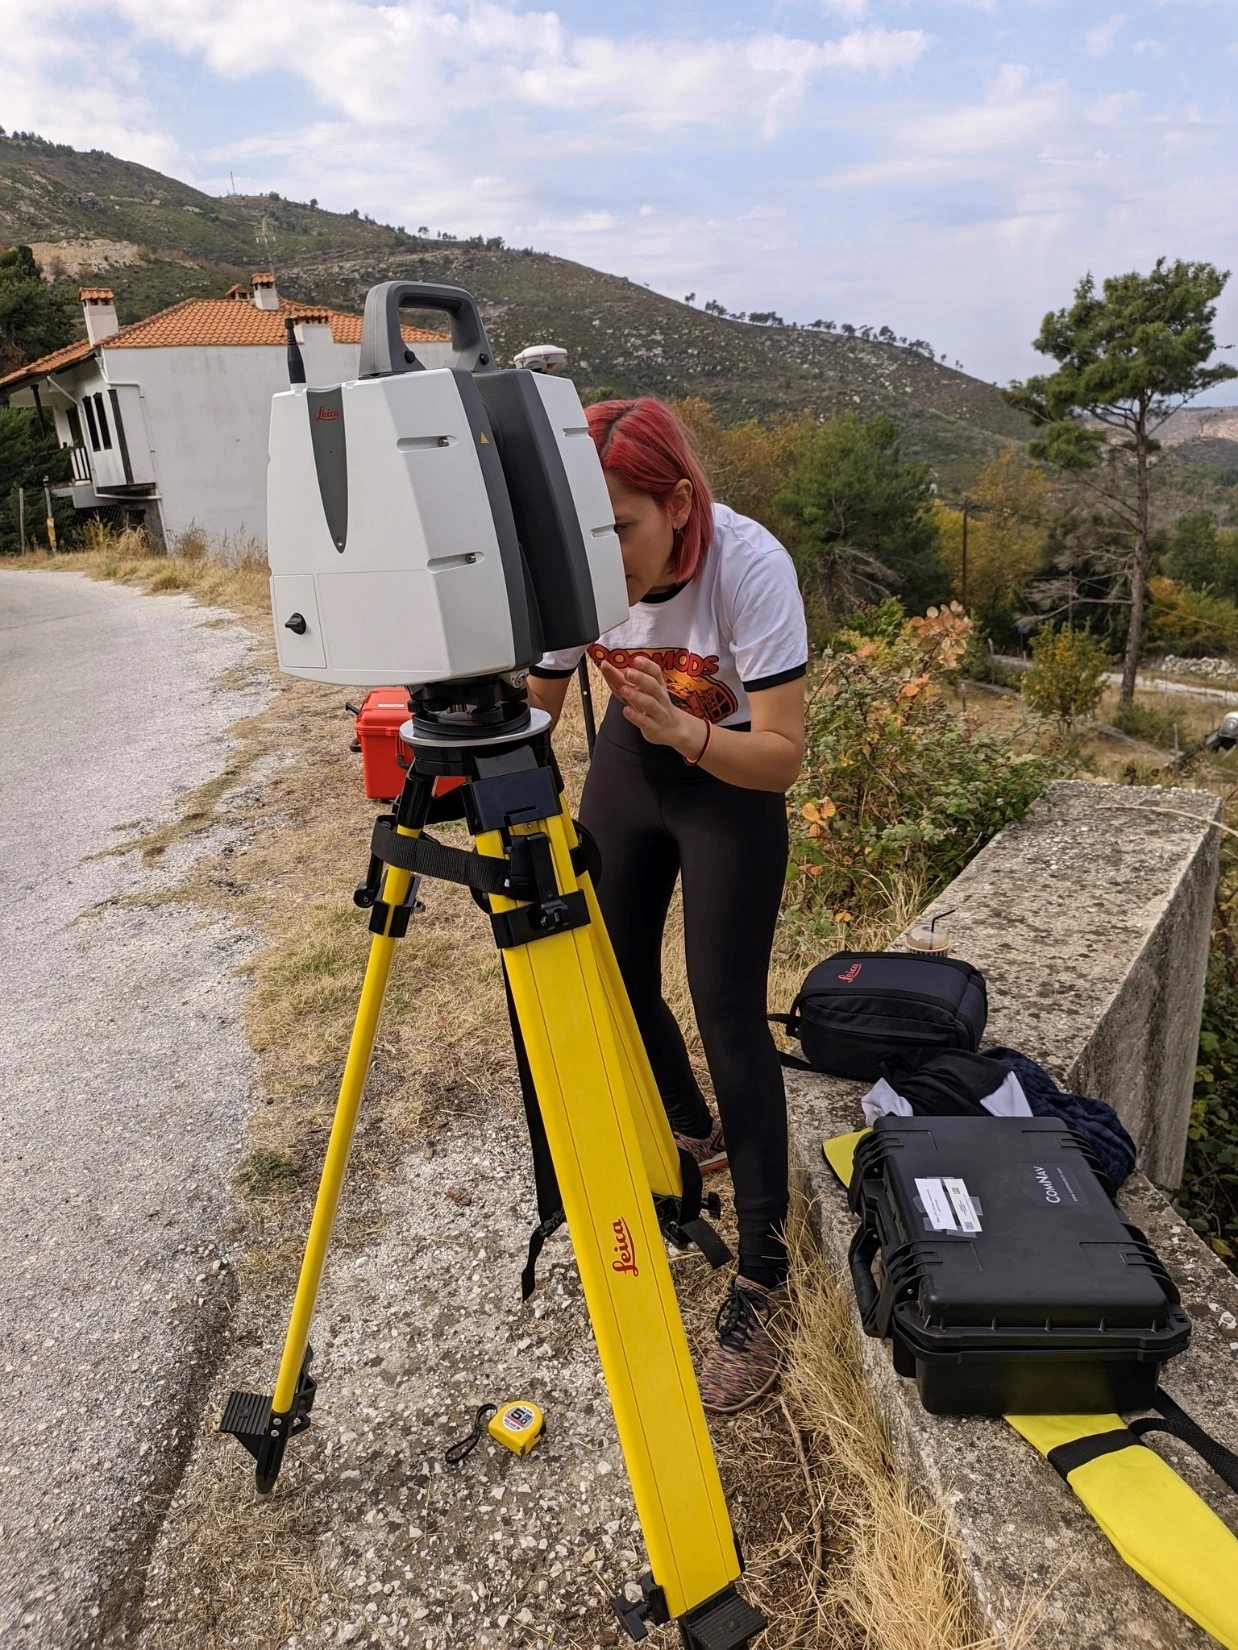
Field measurements connect the condition of an infrastructure asset with the evidence used in analysis. Laser scanning complements the research teams’ data collection and processing tools.
FILMS AND MEDIA
Original photographs of RiskAC infrastructure.
Υλικό υποδομών ΚΕΔΙΑΚ που παρασχέθηκε για τον ιστότοπο. RiskAC infrastructure media supplied for this website.
Γραφικό υποδομών / Infrastructure graphic, ΔΠΘ. Κινητή μονάδα συλλογής δεδομένων / Mobile data collection unit. Αίθουσα ανάλυσης δεδομένων / Data analysis room.
Κινητή μονάδα συλλογής δεδομένων, συνολική όψη / Mobile data collection unit, overall view. Φωτογραφία που παρασχέθηκε για τον ιστότοπο. Photograph supplied for this website.
Επιτόπια αποτύπωση, φωτογραφία και μοντέλο εδάφους του Εχίνου και ιστορικός χάρτης της Δαδιάς από την παρουσίαση ΚΕΔΙΑΚ που παρασχέθηκε για τον ιστότοπο. Field surveying, Echinos photograph and terrain model, and historical Dadia map from the supplied RiskAC presentation. Οι αρχικές αναφορές NASA FIRMS και USGS διατηρούνται στον χάρτη. Original NASA FIRMS and USGS credits remain on the map.
Ο χάρτης σεναρίων σεισμικών βλαβών του οδικού άξονα της Ξάνθης προέρχεται από τη διαφάνεια 15 της παρουσίασης του ΚΕΔΙΑΚ που παραχωρήθηκε για τον ιστότοπο. Διατηρείται ολόκληρη η αρχική εικόνα, με τα υπομνήματά της.
The Xanthi road corridor seismic damage scenario map comes from slide 15 of the owner-supplied RiskAC presentation. The complete original image and its legends are preserved.
FOR STAKEHOLDERS
Let us discuss your needs and the possibilities for scientific collaboration.
Start a conversation